A remastered Azure Virtual Desktop performance troubleshooting guide that uses the CDRN method across CPU, Disk, RAM, and Network, with current Azure Virtual Desktop Insights guidance.

The original version of this article introduced a simple acronym for diagnosing Windows Virtual Desktop performance problems: CDRN for CPU, Disk, RAM, and Network.
That framework still works.
What changed is the tooling around it. In 2026, the fastest route to a defensible answer is to combine the old host-level troubleshooting habits with Azure Virtual Desktop Insights, connection telemetry, and current session-host monitoring rather than relying only on ad hoc checks inside the VM.
Start with triage, not guesswork
Before you blame the image, FSLogix, or “the network,” establish which layer is actually failing.
My recommended starting sequence is:
- Check whether the issue affects one user, one session host, one host pool, or the whole environment.
- Review Azure status and host pool health if the problem is sudden and widespread.
- Open Azure Virtual Desktop Insights and look at Host Performance and Connection Performance.
- Decide whether the dominant signal is compute or storage contention on the session host, or network latency between the user and Azure.
Microsoft’s current guidance makes two thresholds particularly useful:
- Input delay should ideally stay below 100 ms.
- Client-to-region round-trip time should generally stay below 150 ms, with user experience degrading more noticeably above 200 ms.
Those numbers are not a substitute for workload knowledge, but they are a far better starting point than simply asking users whether the session “feels slow.”
CDRN still works
The strength of CDRN is that it forces you to eliminate common causes in a useful order:
- CPU
- Disk
- RAM
- Network
That order is still sensible because CPU, disk, and memory contention inside the session host frequently masquerade as “network lag.”
CPU: find the noisy process, not just the noisy VM
CPU pressure is common in pooled session hosts, especially where browsers, collaboration tools, real-time media, or background agents pile onto the same host.
Azure Virtual Desktop Insights can highlight session hosts with sustained CPU pressure, and Microsoft calls out periods above roughly 60% CPU utilization as worth investigating. That is not a universal failure threshold, but it is a strong signal that the host may be under more pressure than it should be.
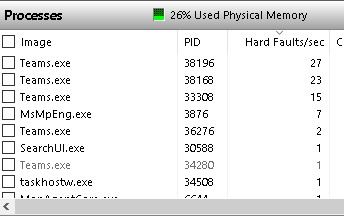
The next step is still classic Windows troubleshooting:
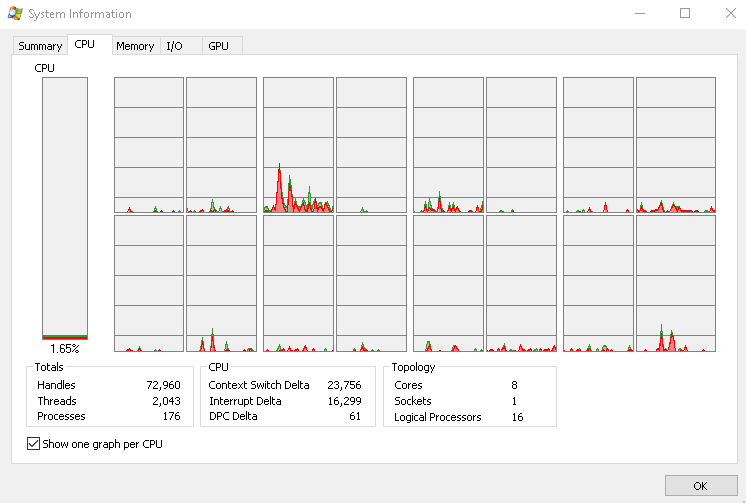
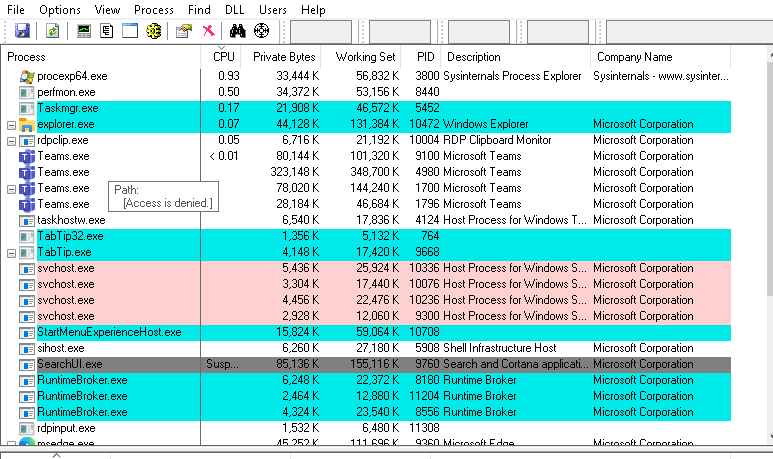
- Task Manager for a fast view.
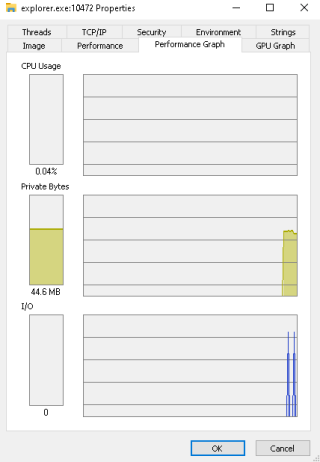
- Process Explorer when you need per-process detail.
- CPU time and thread activity to find the application or service actually consuming the cores.
In practice, common CPU causes are:
- too many users per host
- browsers or add-ins behaving badly
- real-time media workloads sharing the same pool as office workloads
- background indexing, security agents, or application maintenance jobs
CPU symptoms usually look like:
- slow window switching
- delayed typing or click response
- applications hanging or becoming unresponsive
- slow sign-in or sign-out
If CPU is the problem, the fix is rarely “kill a process and hope.” It is usually one of:
- lower the effective user density
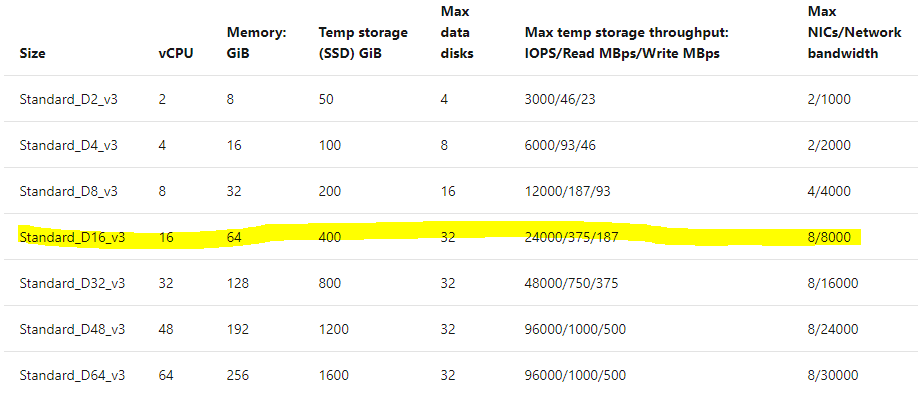
- move the workload to a larger VM size
- separate conflicting user personas into different host pools
- remove or tune a misbehaving background component
Disk: storage is still where many AVD environments fail
Disk remains one of the most common performance problems in multi-session environments.
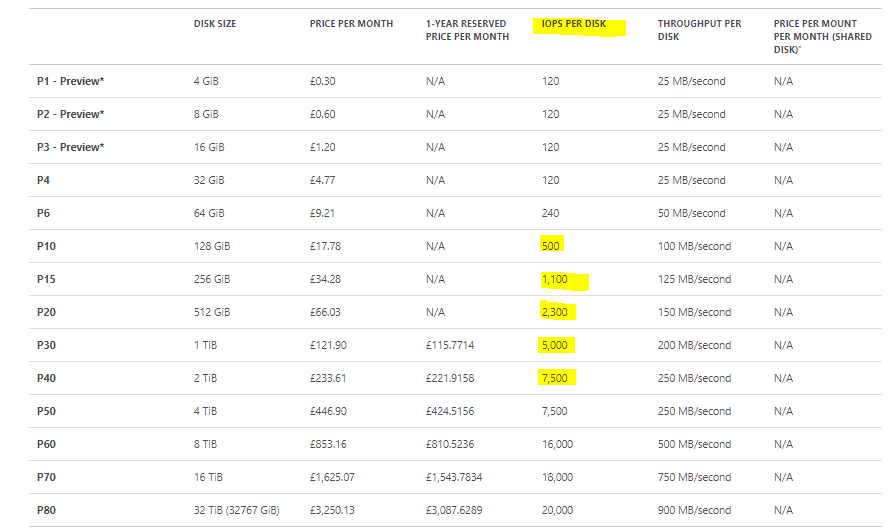
The original article was right to call out the OS disk. Too many teams focus only on VM size and forget that the disk tier, throughput, and IOPS profile can become the bottleneck first.
The part I would update now is the blanket recommendation. Instead of saying “always use P15 or higher,” the better modern guidance is:
- size the managed disk for the throughput and IOPS your host really needs
- validate that the chosen VM and disk combination can deliver that performance
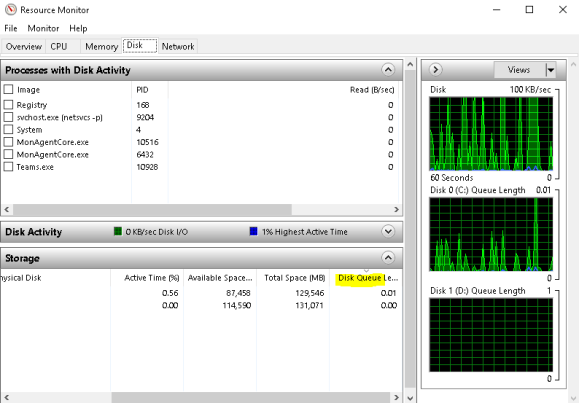
- review disk queue length and disk timing metrics in Azure Virtual Desktop Insights and Windows tools
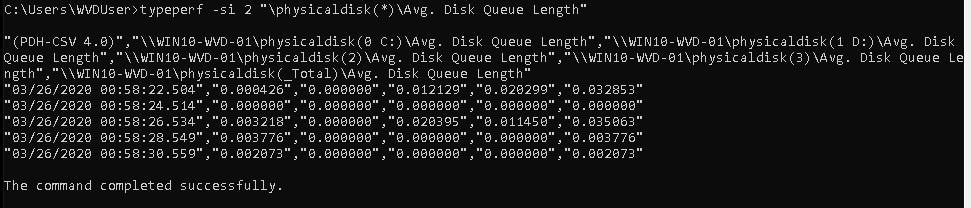
Resource Monitor and typeperf are still useful:
typeperf -si 2 "\\PhysicalDisk(*)\\Avg. Disk Queue Length"
Do not forget FSLogix storage
For pooled Azure Virtual Desktop, the user experience is often just as dependent on profile storage as on the session host OS disk.
That means you need to look at:
- Azure Files or Azure NetApp Files latency
- file-share sizing and concurrency
- sign-in storms
- search indexing behavior
- whether the profile storage is in the same region as the session hosts
If sign-in is slow, application launch is sluggish, or users report erratic pauses after logon, do not stop at the VM. Check the profile container storage path as well.
RAM: high usage is not the same thing as bad performance
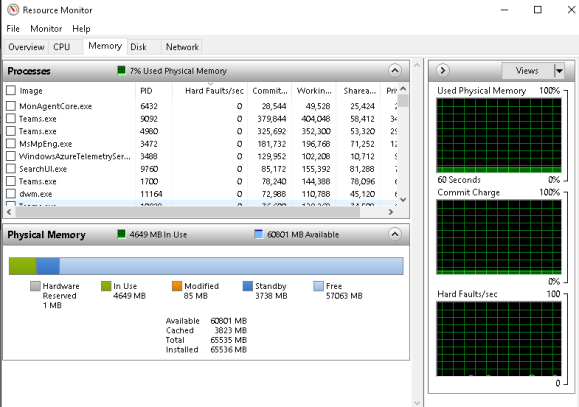
A busy session host can have high memory utilization and still feel fine. The real problem starts when memory pressure causes paging and user workloads spill onto storage.
That is why I still care more about:
- Available MBytes
- Page Faults/sec
- hard faults and page activity trends
than a raw “memory used” percentage on its own.
If memory pressure is the culprit, the symptoms usually include:
- slow application launch
- “Not Responding” states
- low-memory warnings
- unstable behavior in heavier Office or browser workloads
The operational fixes are usually straightforward:
- lower host density
- separate heavy personas from standard users
- scale up the VM size
- use cleaner logoff and reboot hygiene on shared hosts
Network: validate latency before blaming Azure
Network problems are real, but they are often over-attributed.
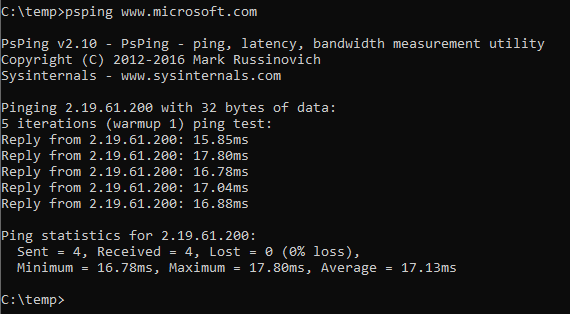
Microsoft’s current troubleshooting guidance points to client-to-region round-trip time as the key first check:
- under 150 ms is generally acceptable
- 150-200 ms can still be workable for lighter use
- above 200 ms is where users start to feel the session degrade
That is why I now start network troubleshooting in Azure Virtual Desktop Insights or the connection diagnostic tables, not with old WVD-specific endpoint assumptions.
Common network-related symptoms include:
- jumpy mouse or delayed cursor movement
- poor audio quality
- slow screen redraws
- intermittent disconnects
- typing lag
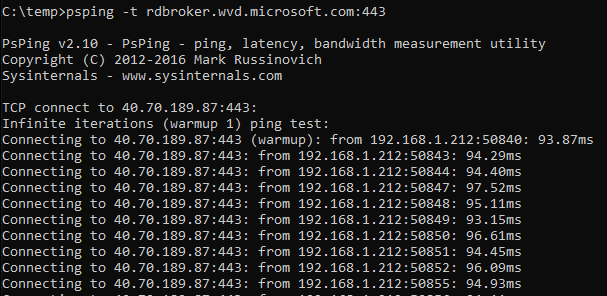
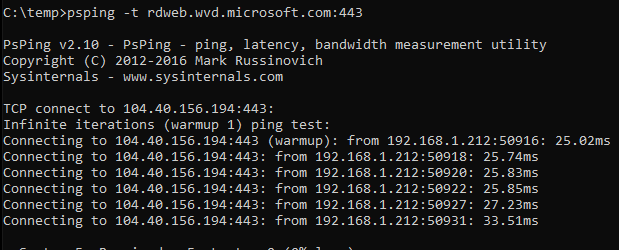
The practical checks are:
- confirm the user is reaching the closest sensible Azure region
- look at gateway-region and RTT trends in Azure Virtual Desktop Insights
- check the user’s local internet quality and Wi-Fi stability
- review firewall, ExpressRoute, VPN, or bandwidth-shaping policies
- confirm the issue is not really CPU, memory, or disk pressure on the host
One of the most useful modern insights is this: if RTT is acceptable but input delay is high, the problem is often inside the session host, not between the user and Azure.
The modern troubleshooting workflow I recommend
When performance complaints come in, I use this order:
- Review Input Delay and host performance in Azure Virtual Desktop Insights.
- Review RTT and connection quality for the affected users or gateway regions.
- Identify whether the issue follows a user, a session host, a time window, or a workload type.
- Work through CPU, Disk, RAM, Network in that order.
- Change only one variable at a time, then validate again in Insights.
That matters because AVD performance issues are often layered. A session host with too many users can create CPU pressure, which drives paging, which increases disk latency, which users then describe as “network lag.”
My view now
The best part of the original article was the discipline of the acronym. CDRN is still useful because it stops troubleshooting from turning into random trial and error.
The update is that you should now pair CDRN with platform telemetry:
- Azure Virtual Desktop Insights for input delay and host metrics
- connection performance data for RTT and client-side quality
- host-level tools only after the platform view tells you where to look
That approach gets you to root cause faster and avoids the classic mistake of resizing VMs when the real issue is storage, or blaming the network when the real issue is host density.